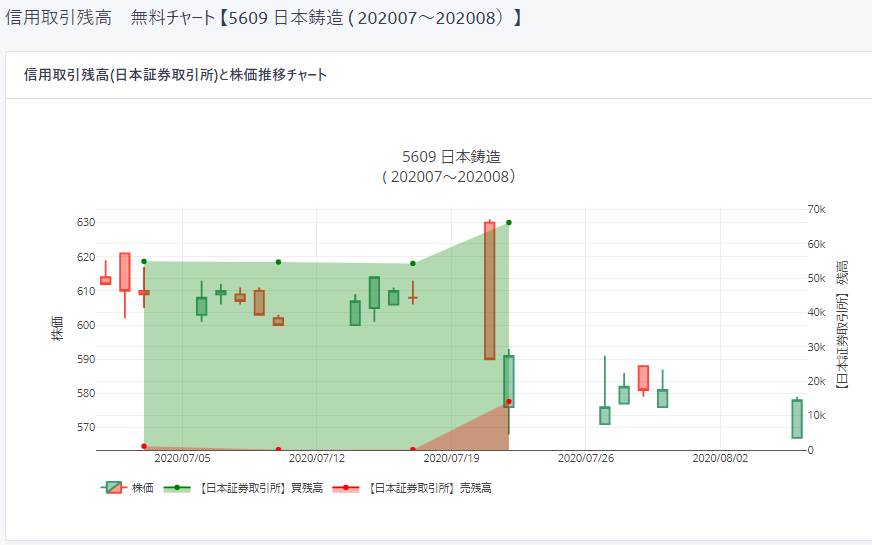
How to use this site (Stock Price and Margin ratio and Outstanding Margin Trading)
How to use stock search
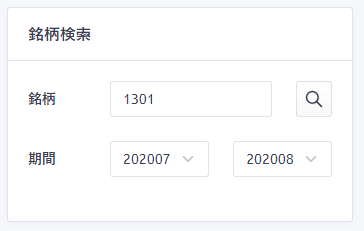
■When entering the Stock code
①Enter the Stock code. (Example: If you want to search 1301 KYOKUYO CO.,LTD.)
②Press Enter or press the Search button.
③Transit to the chart screen.
■When selecting from the Stock name (only part is possible)
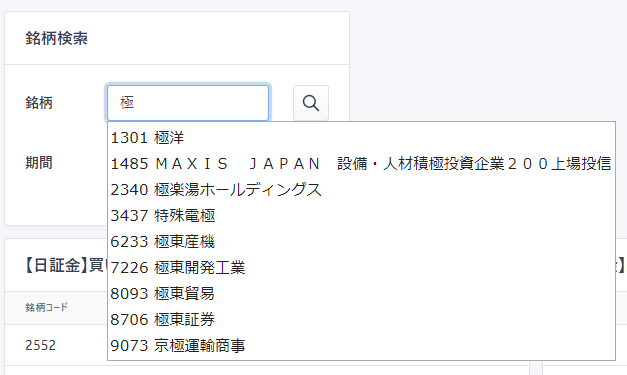
①Enter a part of the brand name. (Example: If you want to search 1301 KYOKUYO CO.,LTD.)
②Candidates will appear, so choose one.
③Press Enter or press the Search button.
④Transit to the chart screen.
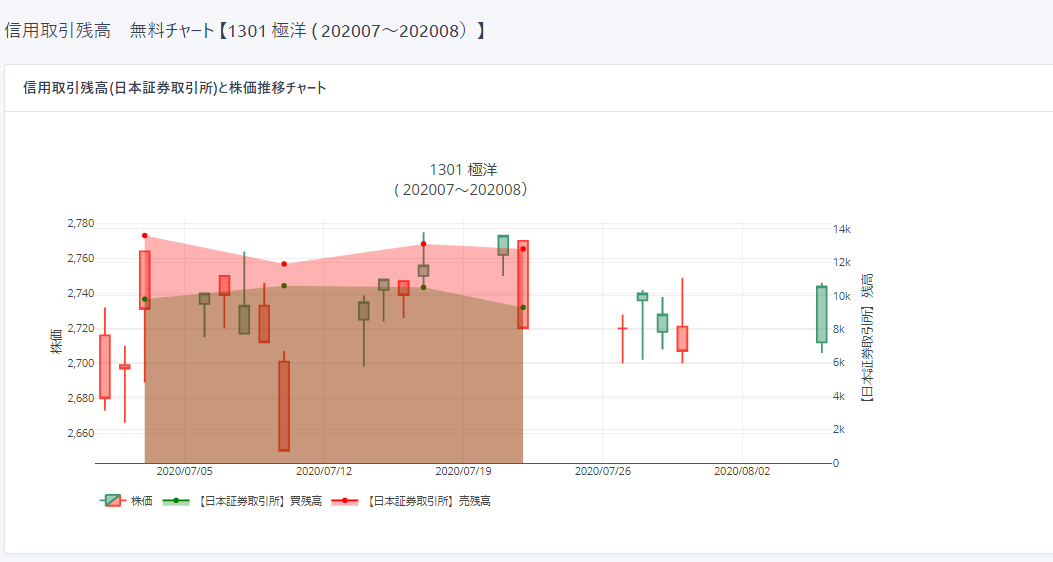
■Chart screen
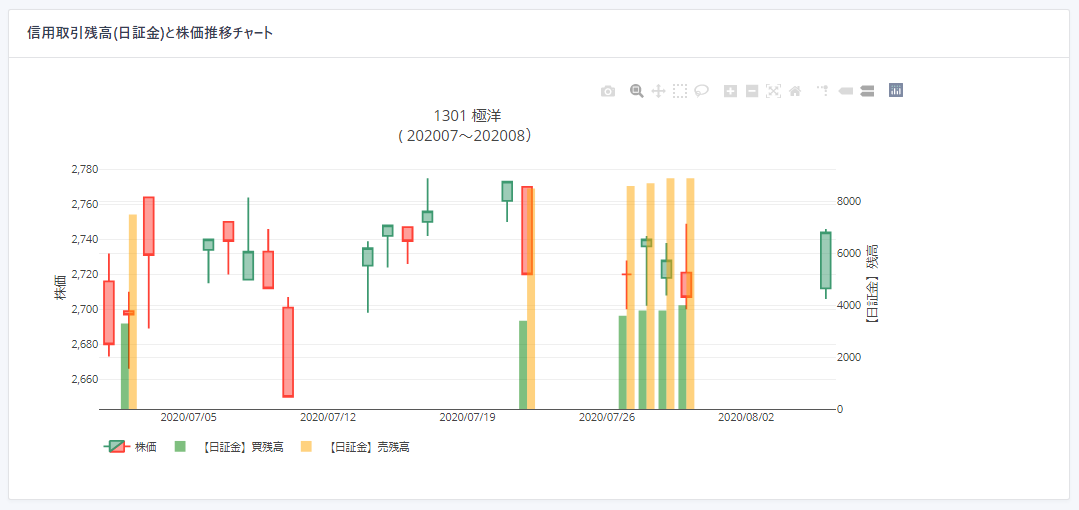
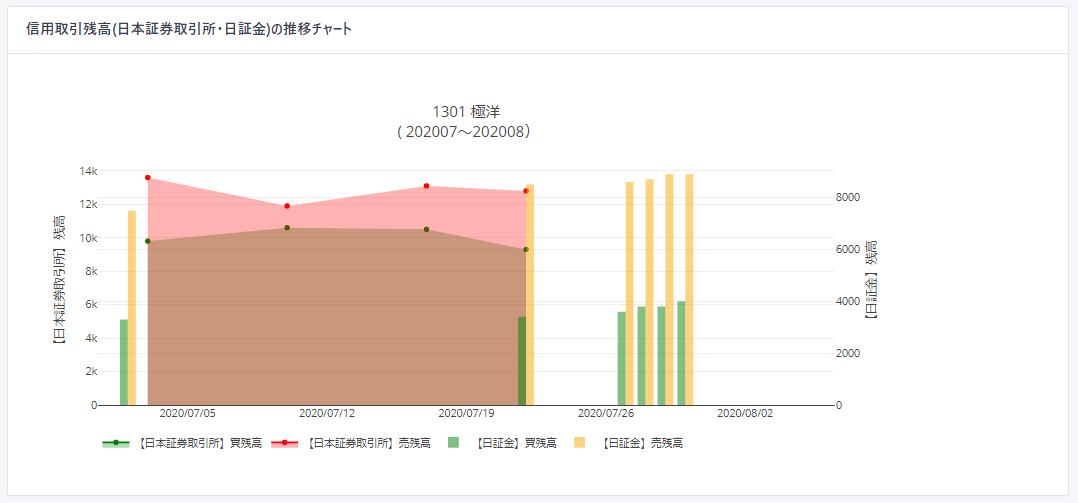
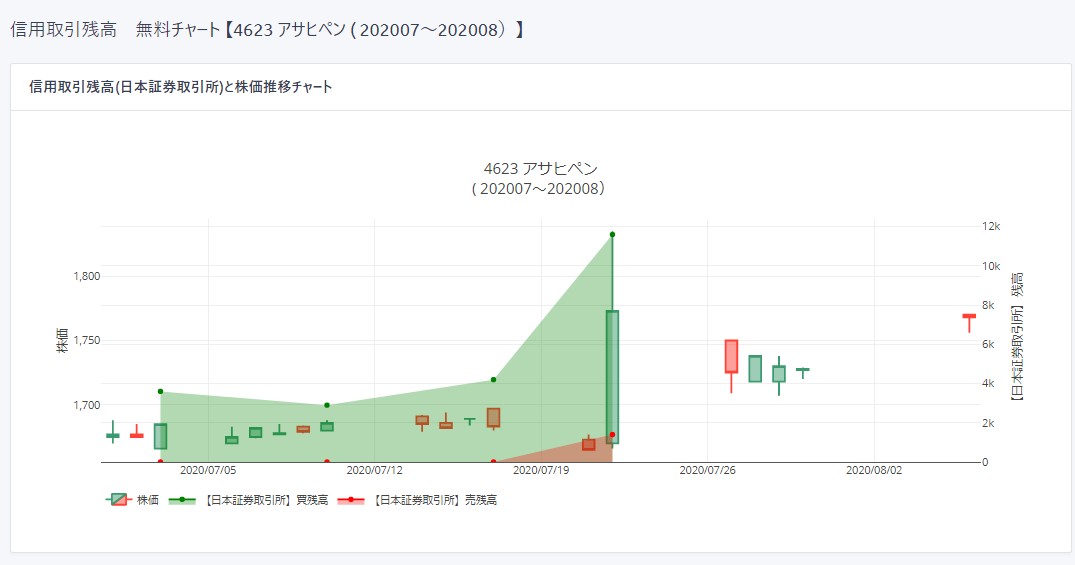
On the chart screen, the stock prices of individual stocks, margin trading of JPX TES, and margin trading of JSF are combined and displayed on the chart.
How to use the short sale balance list of the day by institutional investor
The short sale information for the day is displayed by institutional investor in descending order of the number of short sales remaining.
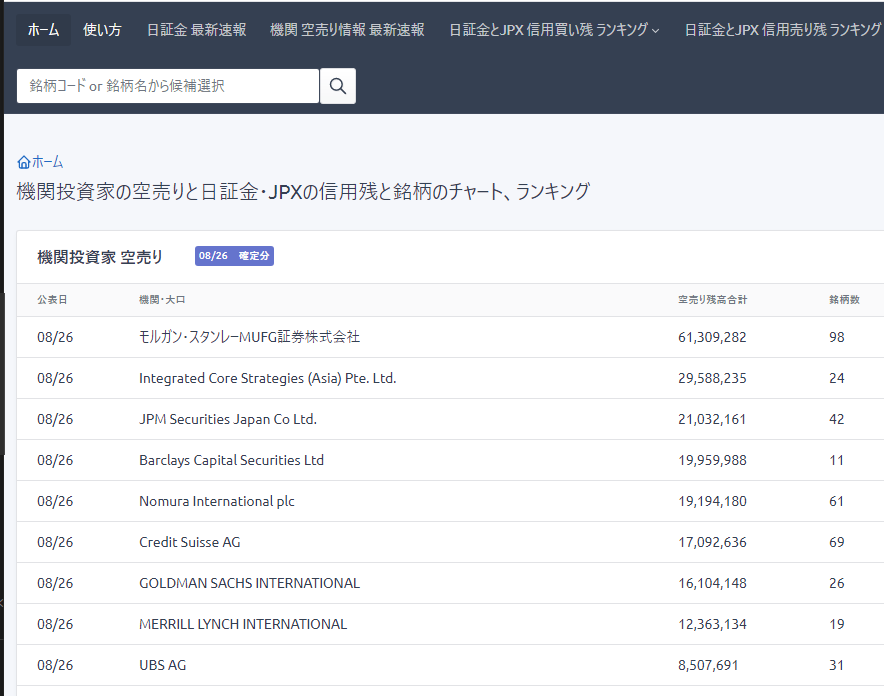
①Click the line of the institution you are interested in. (Example: For Morgan Stanley MUFG Securities)
②①You can view the history of short-selling stocks and short-selling balances of the institutions specified in.
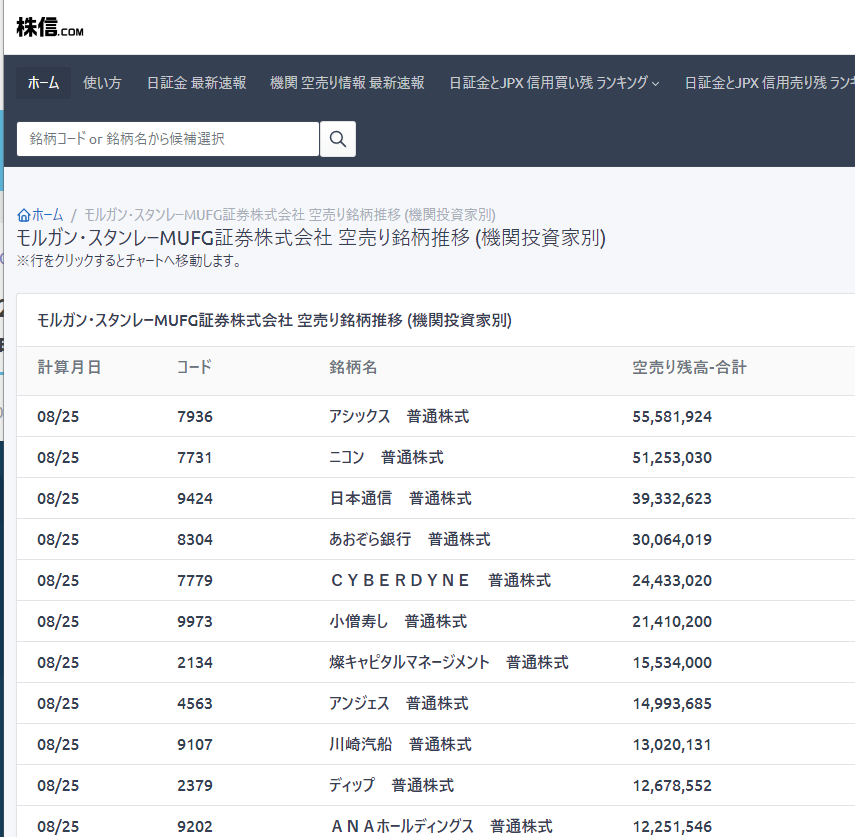
③If you click on the stock line, you can see the short-selling balance transition chart for each stock.
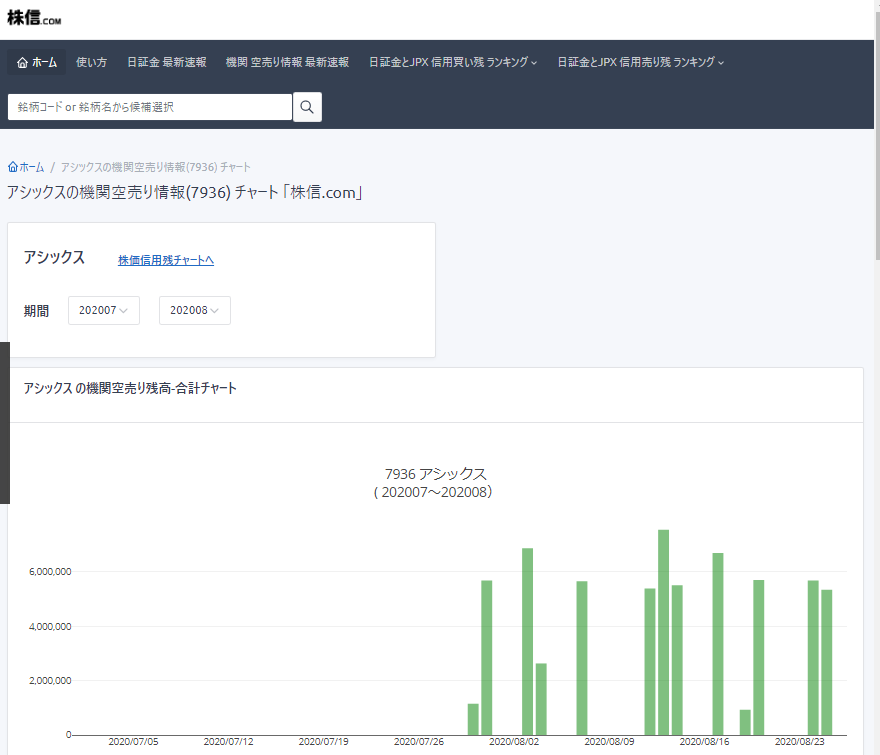
How to use the latest breaking news of short-selling stocks of institutional investors
Select "Institutional Short-selling Infomation News" from the menu.

①Click the row of the stock you are interested in. (Example: If you choose Nikon)
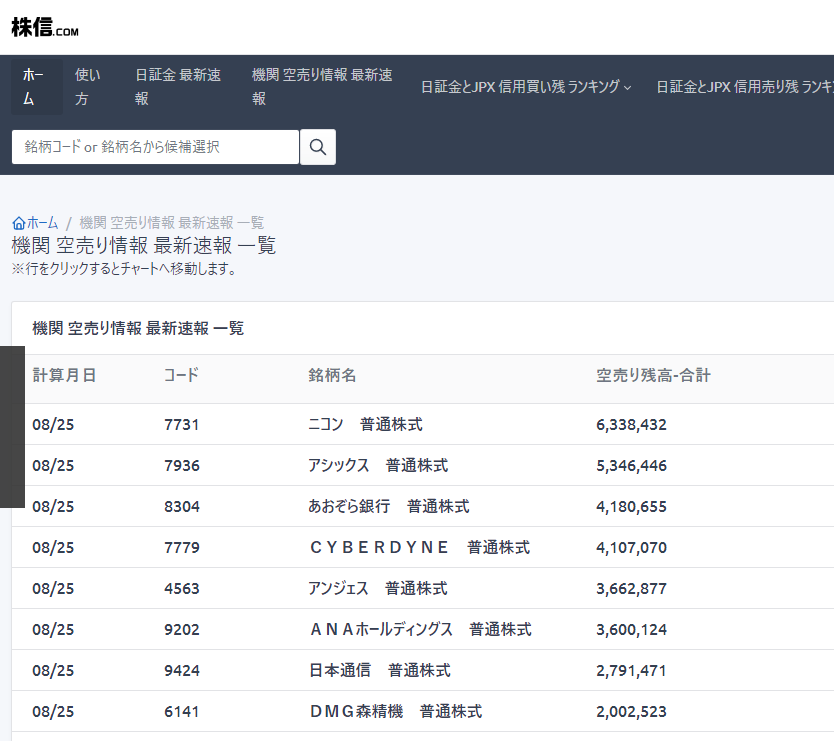
②You can see the Institutional investor Short Selling Positions chart by Stock.
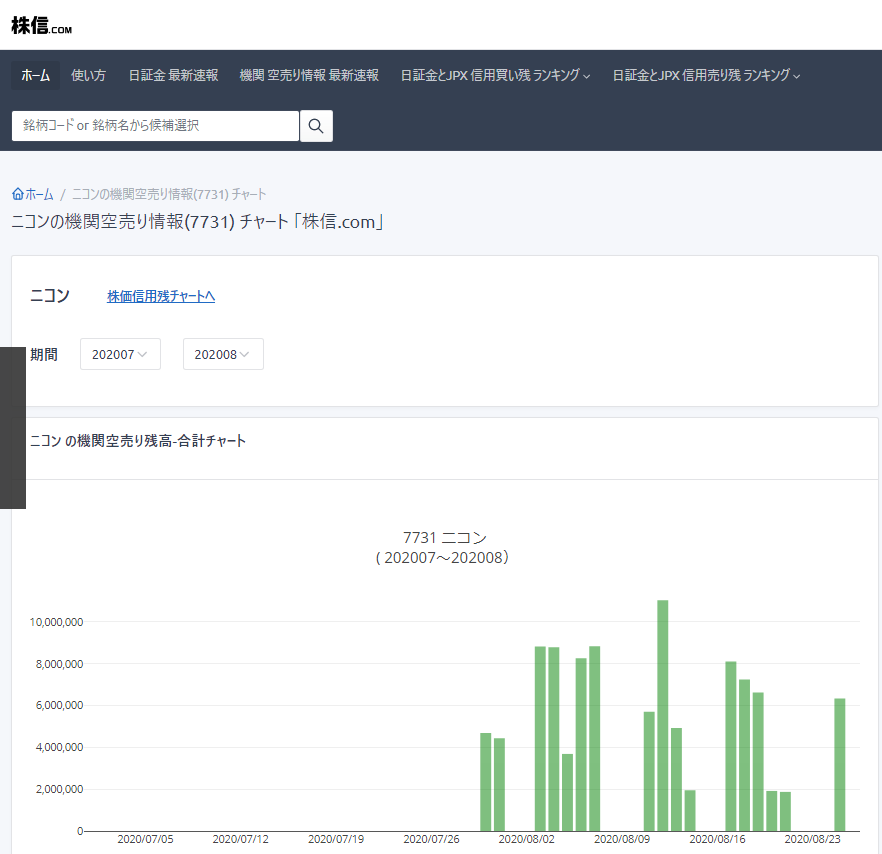
How to use Outstanding Margin Trading ranking
■Select the ranking you want to see from the menu.

■If you want to see the ranking of Outstanding Purchase
①Click the Outstanding Purchase ranking in the menu, then click the ranking that appears in the list.
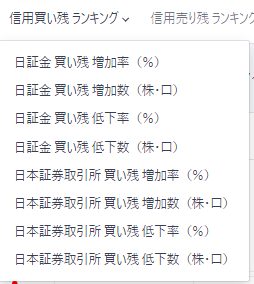
②The top 50 rankings are displayed.
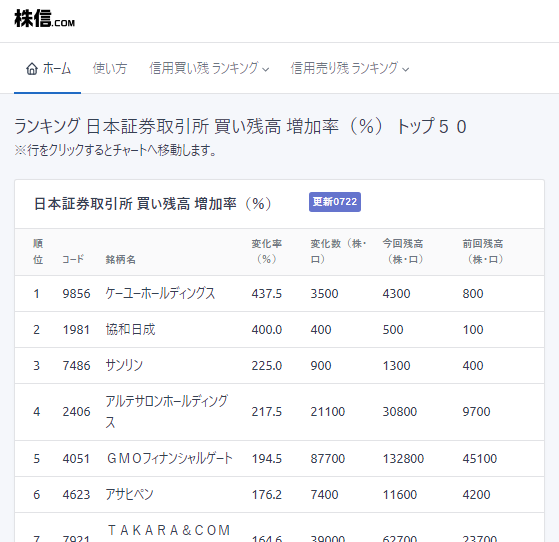
③Click the row of the brand you are interested in to move to the chart screen. (Example: Click 4623 Asahipen)
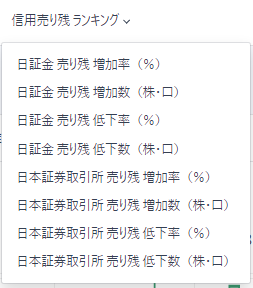
■If you want to see the ranking of Outstanding Sals
①Click the Outstanding Sals ranking in the menu, then click the ranking that appears in the list.
②The top 50 rankings are displayed.
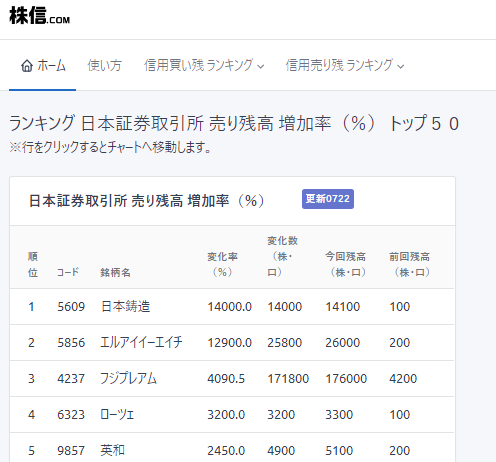
③Click the row of the stock you are interested in to move to the chart screen. (Example: Click 5609 Nippon CHUZO)
